

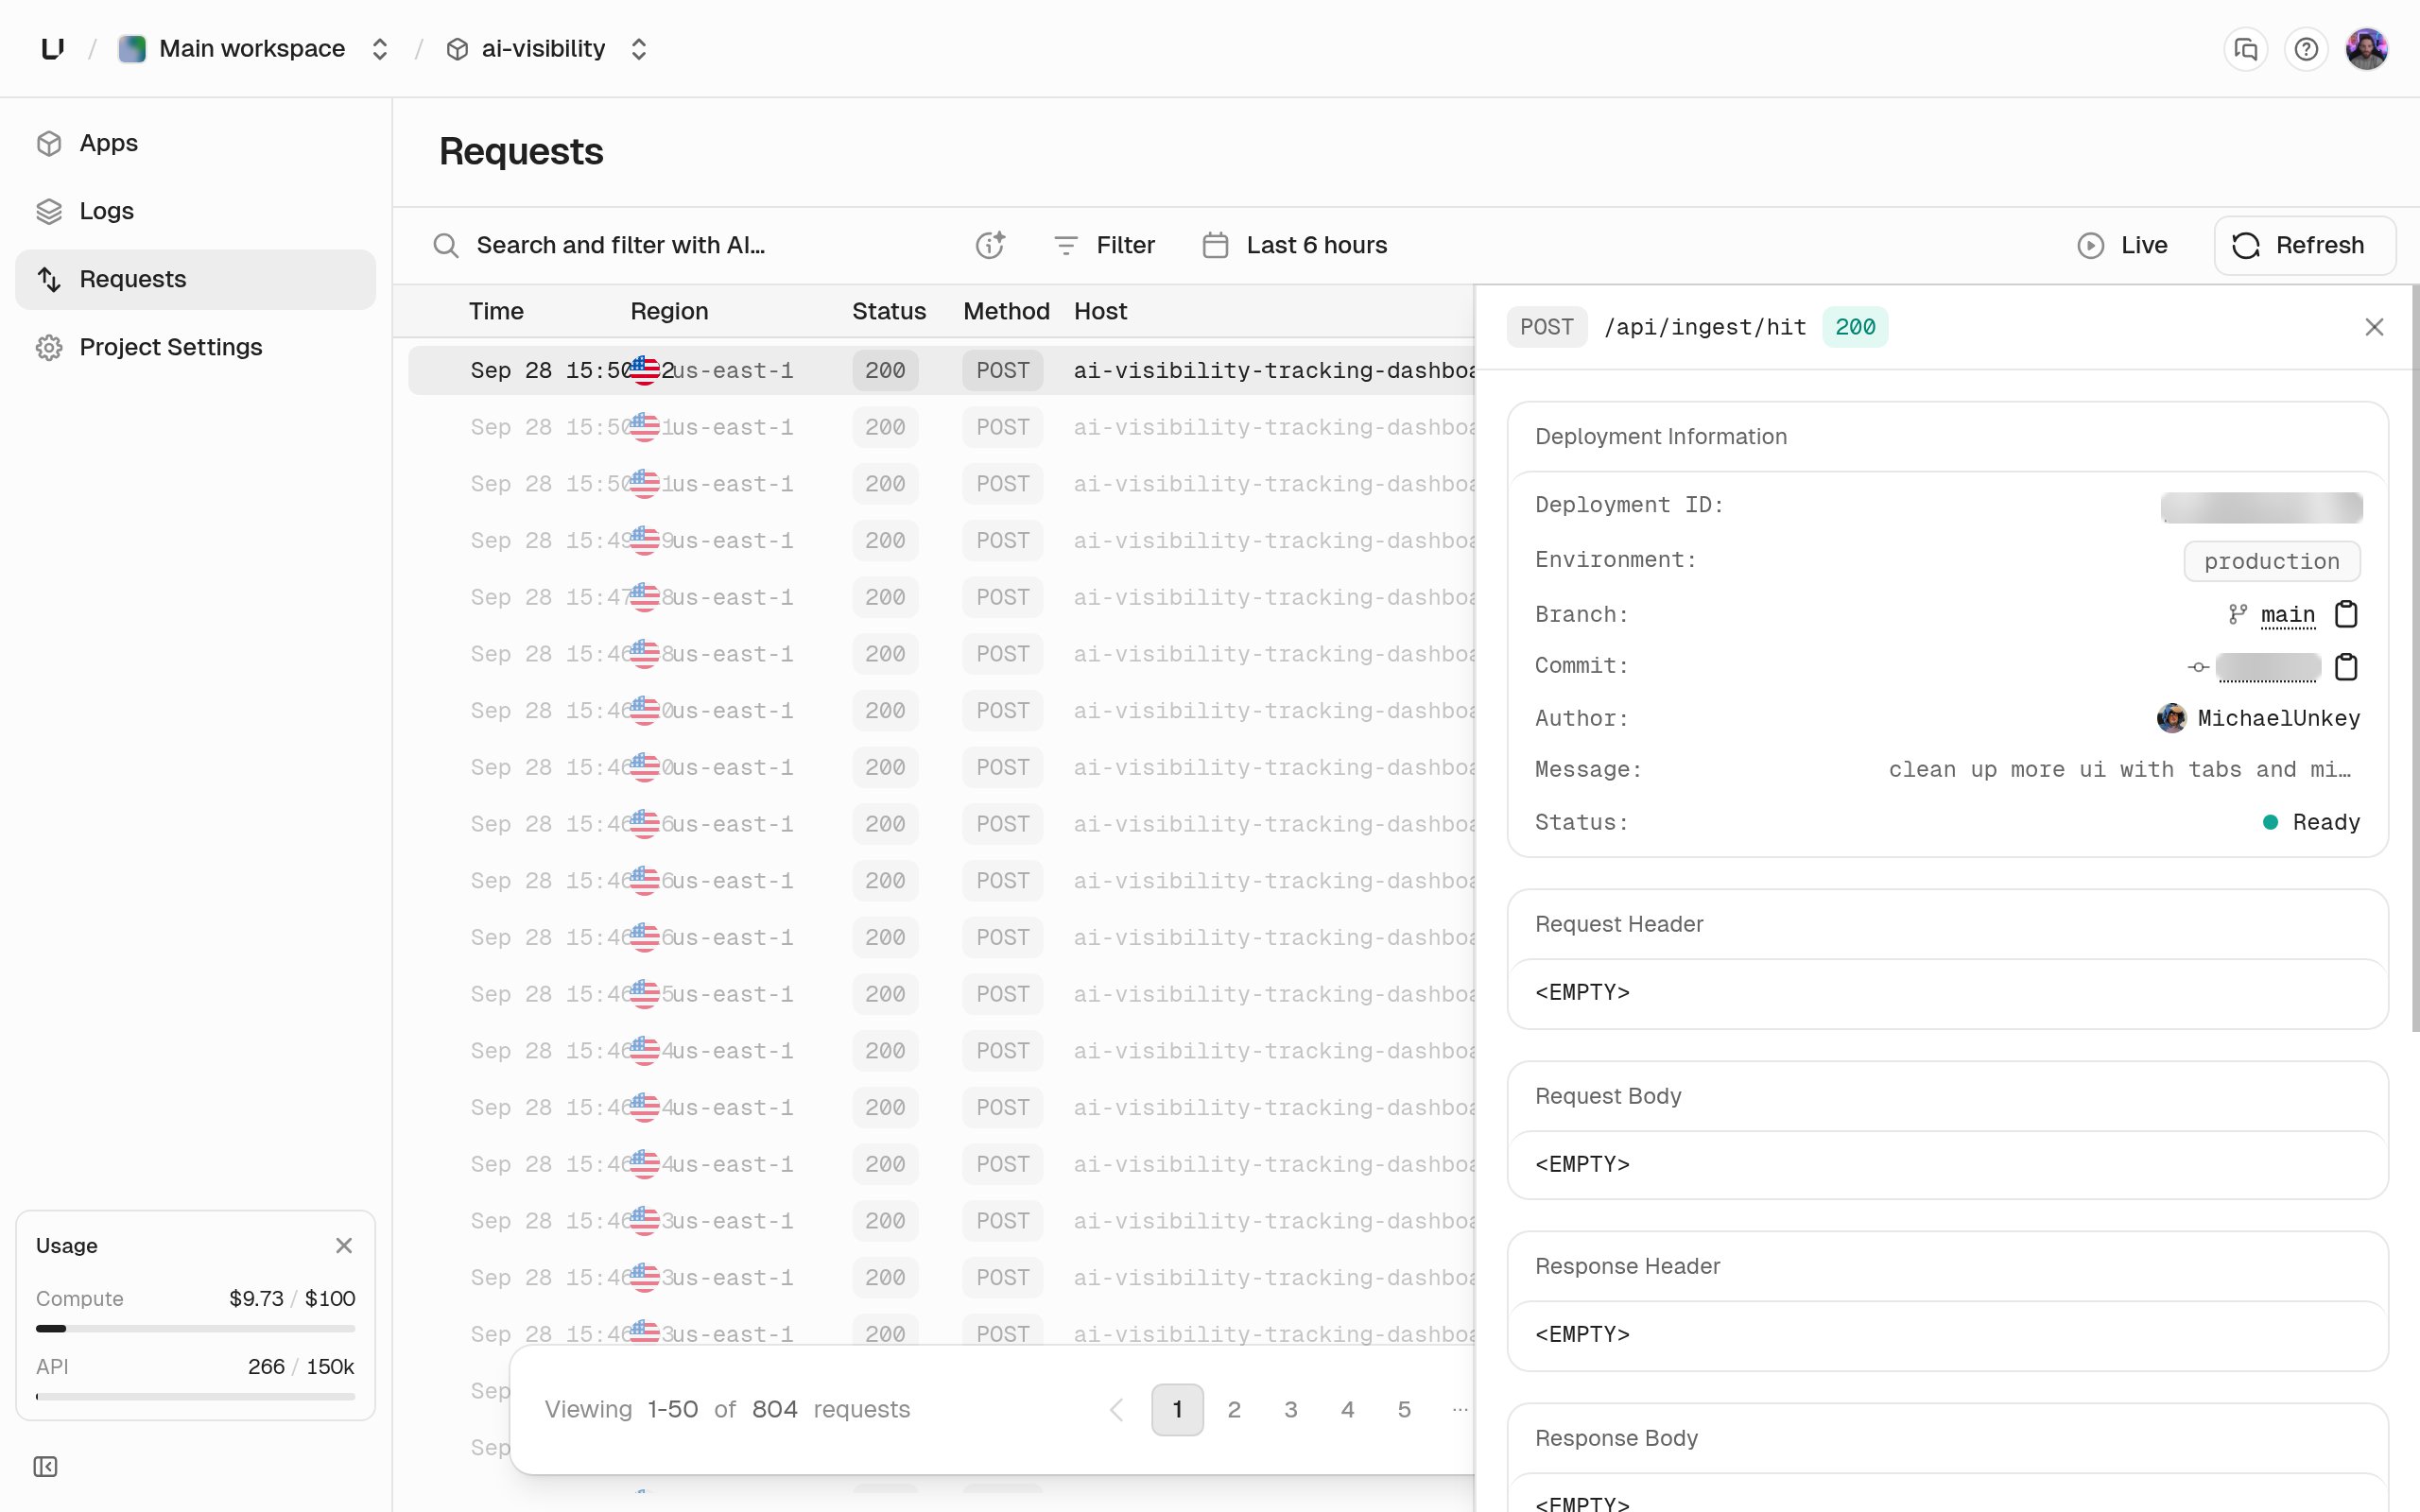
Why a request is missing
Only requests that reached your app are logged. These aren’t:- Requests rejected by a gateway policy. The caller got a
401,403,429, or400, and your app never saw it. - Requests the gateway couldn’t route, such as an unknown hostname or a deployment with no running instances.
What each row has
What a logging policy adds
A logging policy can also save request headers (with the user agent and client IP), response headers, request and response bodies (up to 1 MiB each), and the query string. API keys are always redacted, so a saved request never contains a usable key.Filter the log
Filters narrow the list and the charts above it.
Click a row to see all of it, including any saved headers, bodies, and query data.
Retention and access
Rows are kept for 7 days, and the dashboard shows all of them. The analytics API can reach back 3 days on Starter and 7 on Pro and Business, because Business’s 14-day query range is longer than the rows are kept. A query that reaches further fails witherr:user:bad_request:query_range_exceeds_retention. See Compute limits.
Request counts and latency charts on Metrics go back further. To query rows with SQL, use the gateway_requests_v1 table. See Query gateway requests and runtime logs.