Traffic
Traffic charts cover the last 6 hours in 15 minute buckets.- Requests per second: the average over the last 6 hours.
- Latency: the total time of each request, as in the request log. Pick p50, p75, p90, p95, or p99.
Resources
Resource charts add up all the deployment’s instances. You can pick a time window from 15 minutes to a year.
Compare CPU and memory with the limits in runtime settings to decide whether to raise them or add instances. See Instances and autoscaling.
Longer windows show coarser points: 15 seconds up to an hour, 1 minute up to a day, 1 hour up to 30 days, and 1 day beyond that. Fine-grained points are deleted first. See retention.
Why an instance restarted
The deployment lists instance events: an instance becomingrunning, waiting, or terminated, with its restart count, exit code, and a reason. Two reasons to know:
OOMKilled(often with exit code137): the instance ran out of memory. Raise the memory limit.CrashLoopBackOff: the process keeps exiting before the health check passes. The runtime logs for that instance say why.
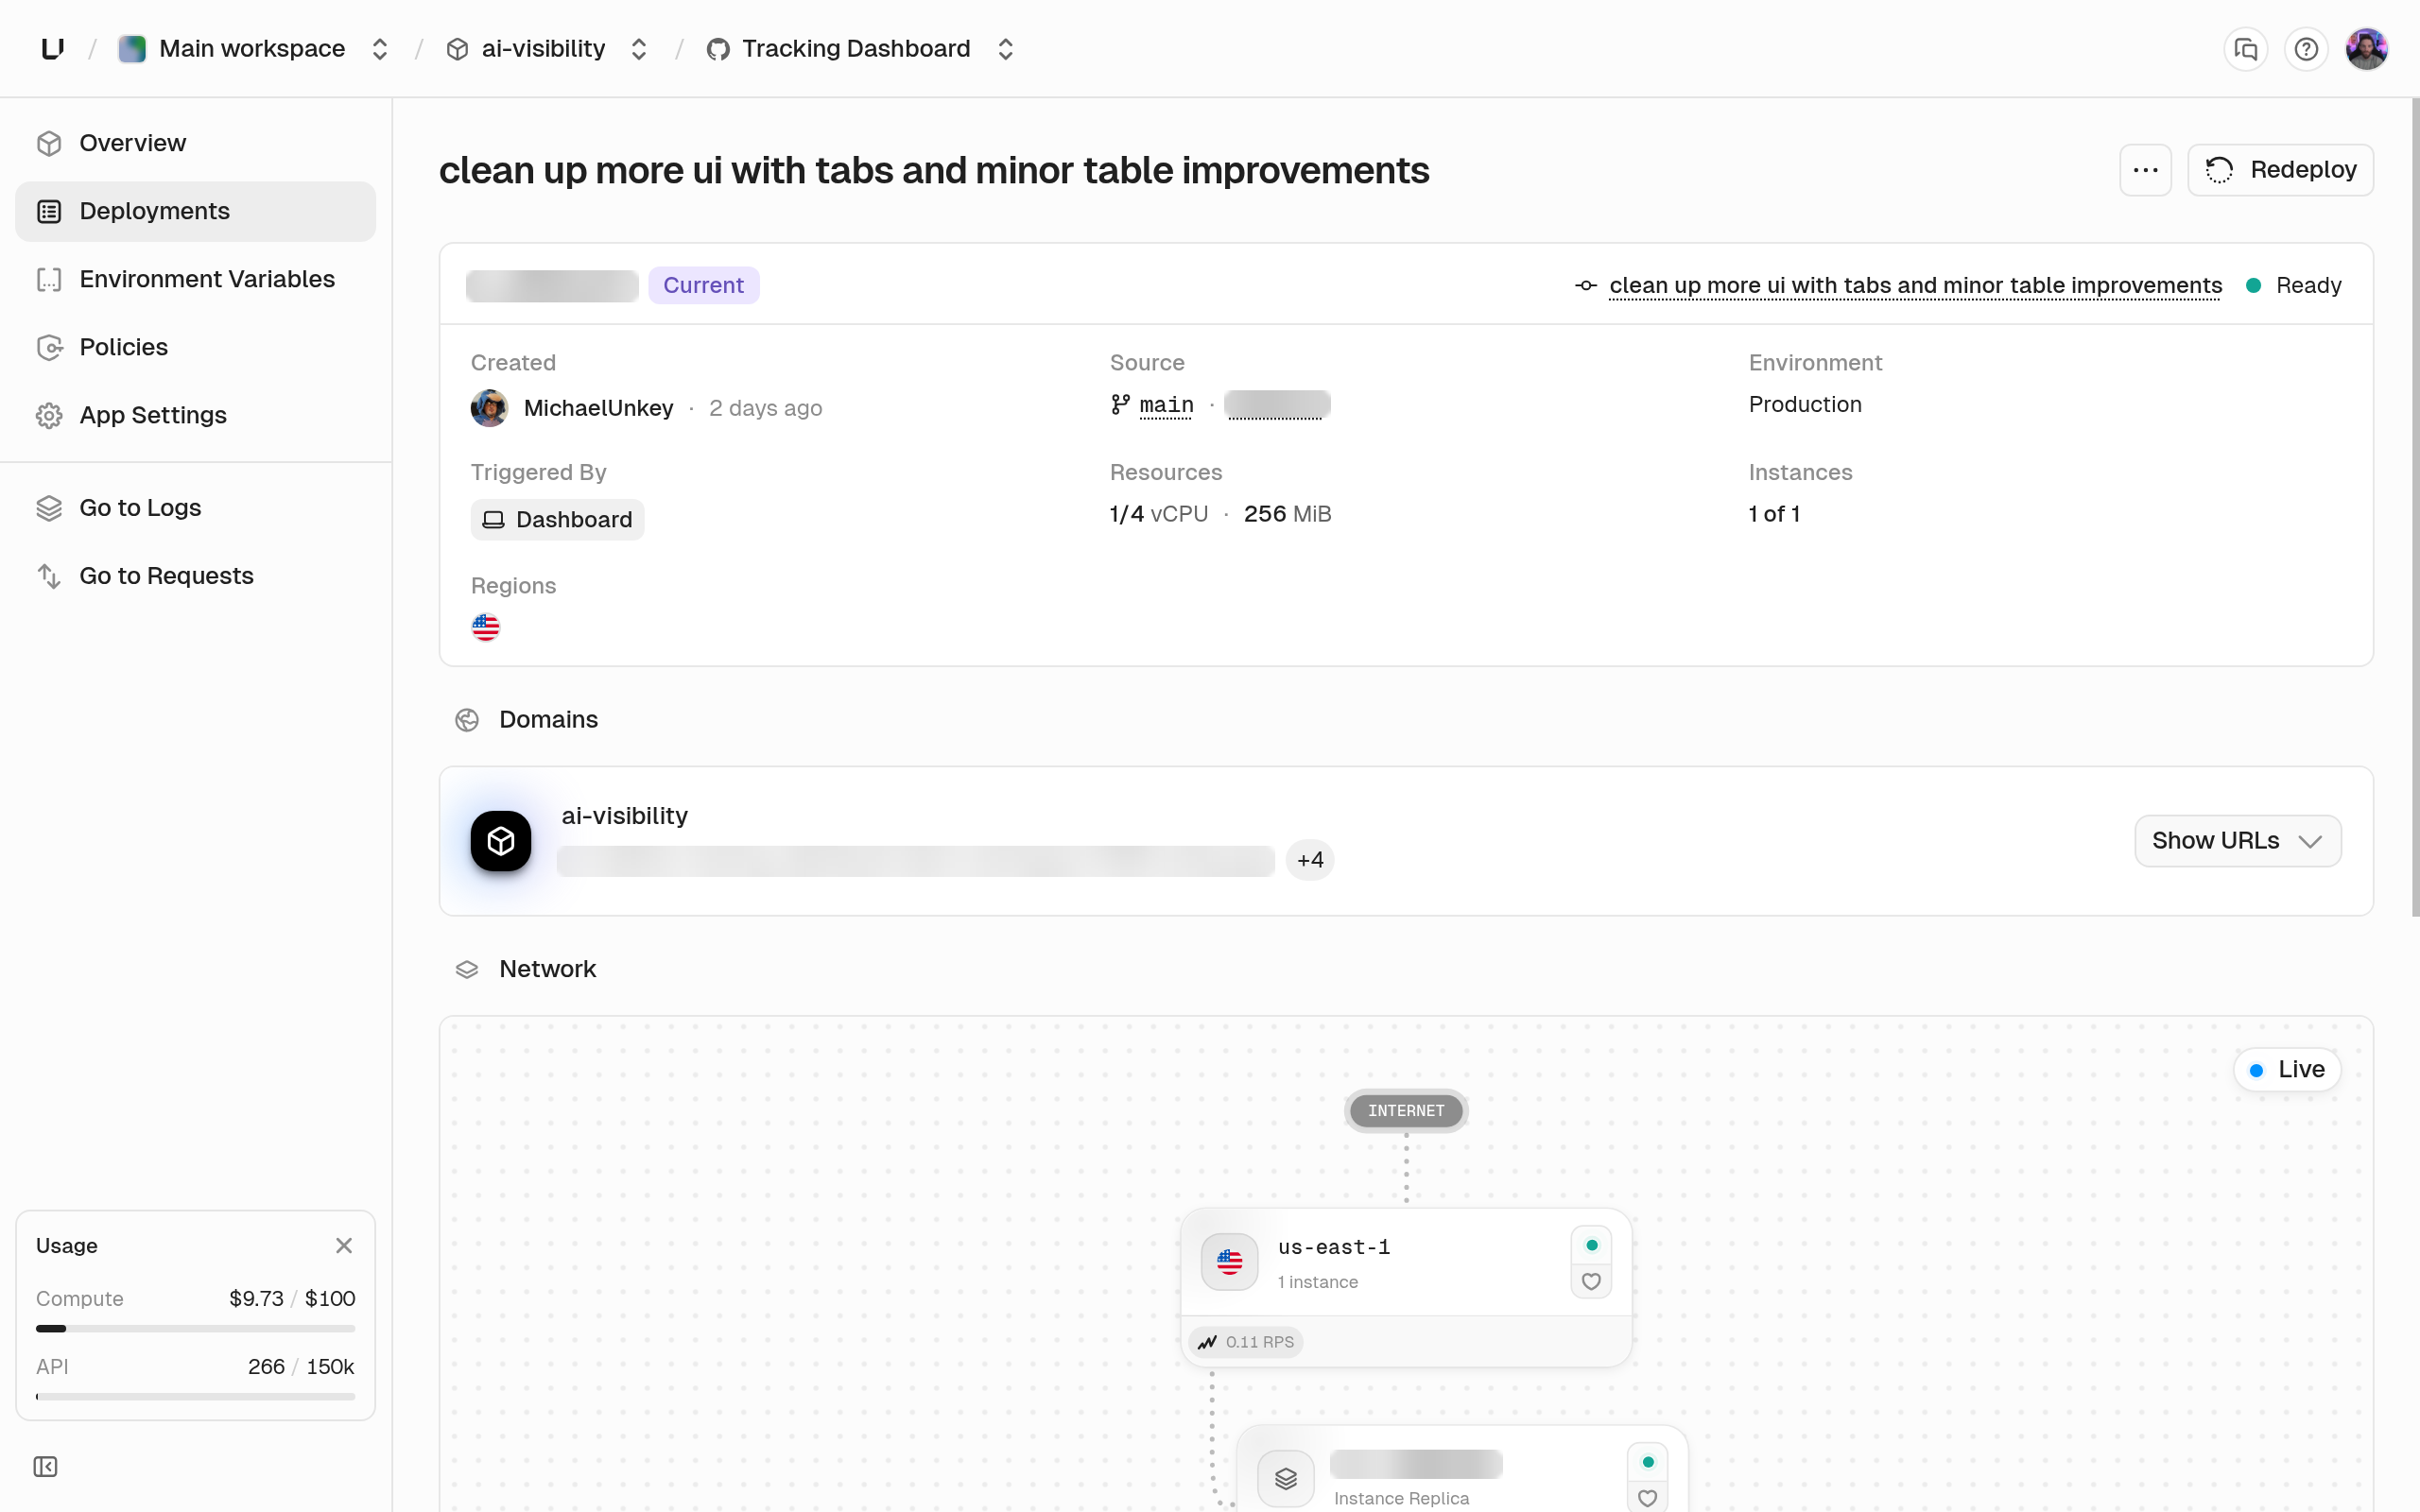
Network view
The Network view shows each region and running instance with its request rate over the last 15 minutes. Use it to check that every region gets traffic and that load is spread across instances. See Regions.