> ## Documentation Index
> Fetch the complete documentation index at: https://unkey.com/docs/llms.txt
> Use this file to discover all available pages before exploring further.
> ## Agent Instructions
> Unkey is two separate products. Compute builds, deploys, and runs apps behind a gateway. API Management issues API keys, enforces rate limits, manages identities and permissions, and reports usage. Say which product a page belongs to; a reader can use either without the other.
> Every Unkey API endpoint is an HTTP POST to https://api.unkey.com/v2/{service}.{procedure} with a root key in the Authorization: Bearer header. Root keys are workspace scoped.
> Error codes have the form err:{system}:{category}:{specific} and each has a page at /errors/{system}/{category}/{specific}.
> The word environment means production or preview in Compute. Rate limiting has four meanings on this site; the glossary lists them.
# Metrics
> The traffic, latency, and resource charts on a deployment and what they measure.
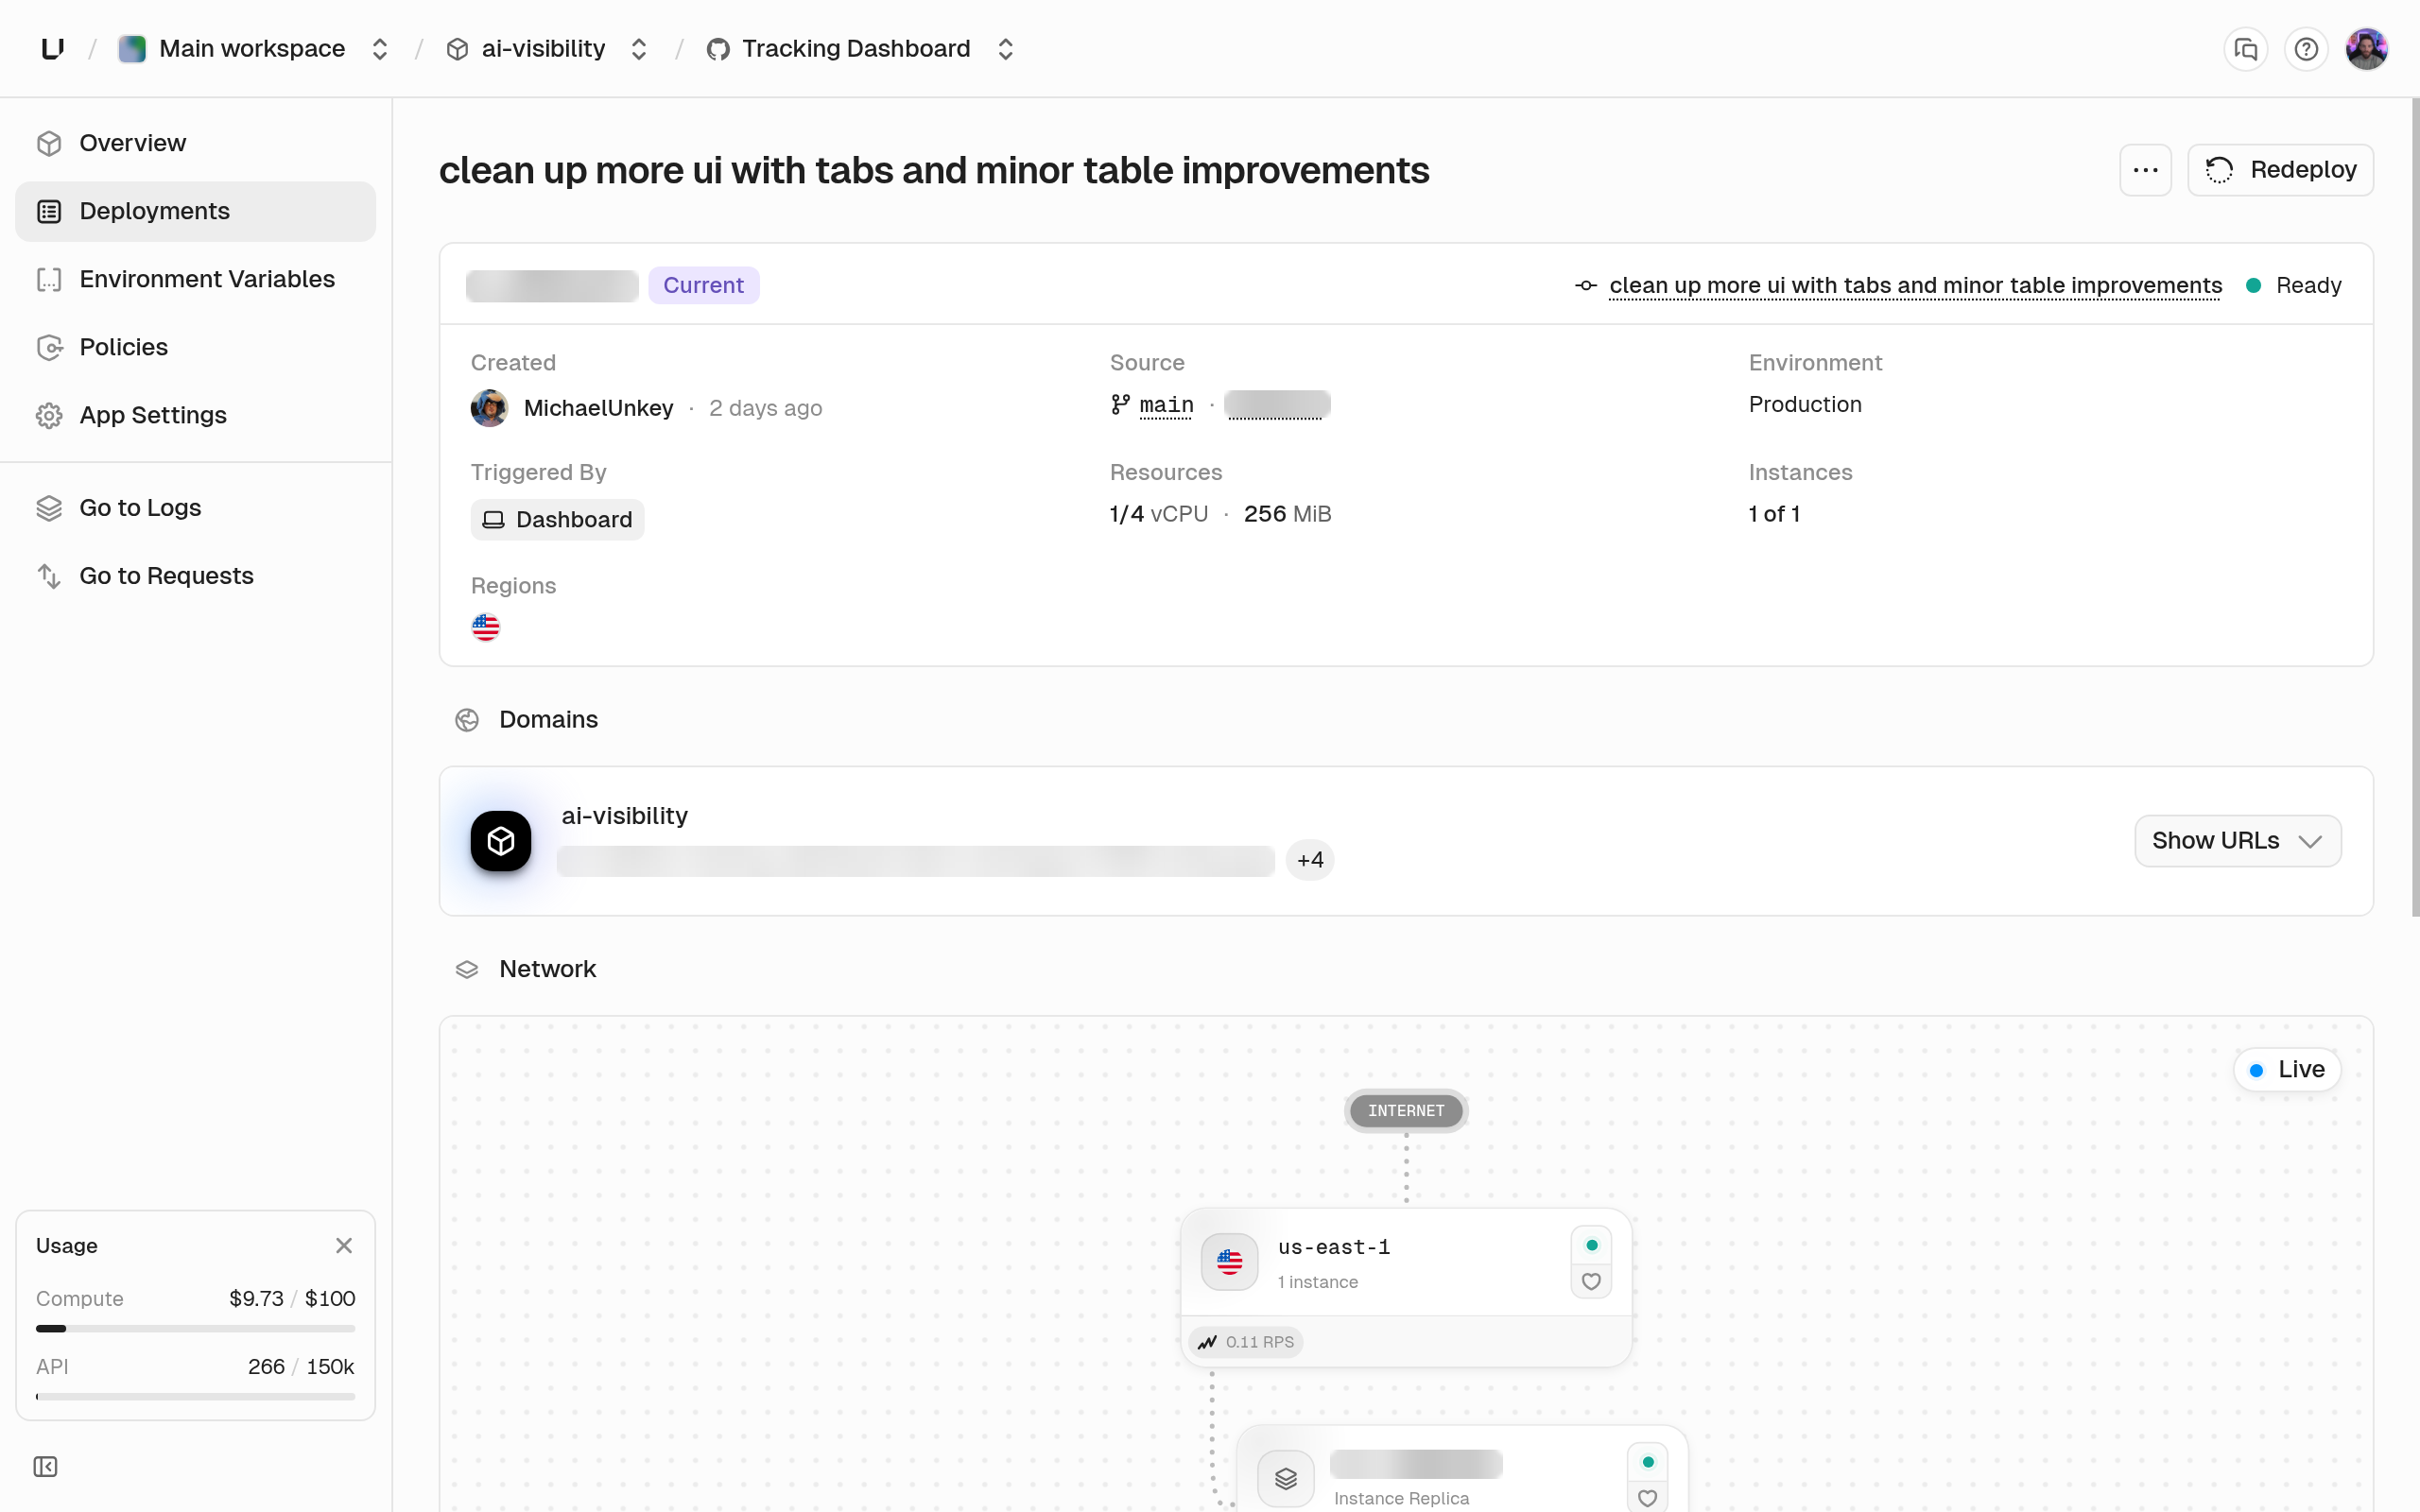
Metrics show how much traffic a deployment gets, how fast it responds, and how much CPU and memory it uses. You don't need to add anything to your code. Open the app, click **Deployments**, and open a deployment. Its overview has the charts, and its **Network** view shows where requests are going.
## Traffic
Traffic charts cover the last 6 hours in 15 minute buckets.
* **Requests per second:** the average over the last 6 hours.
* **Latency:** the total time of each request, as in the [request log](/docs/compute/observe/requests). Pick p50, p75, p90, p95, or p99.
Like the request log, these don't count requests a policy rejected.
## Resources
Resource charts add up all the deployment's instances. You can pick a time window from 15 minutes to a year.
| Chart | What a point means |
| - | - |
| CPU | Millicores used on average during each point's time span |
| Memory | Peak memory in use per instance, added up |
| Disk | Peak disk in use per instance, added up |
| Instances | Number of instances running |
| Network ingress, network egress | Bytes per second in each direction, public and private traffic combined |
Compare CPU and memory with the limits in [runtime settings](/docs/compute/configure/runtime-settings) to decide whether to raise them or add instances. See [Instances and autoscaling](/docs/compute/concepts/instances-and-autoscaling).
Longer windows show coarser points: 15 seconds up to an hour, 1 minute up to a day, 1 hour up to 30 days, and 1 day beyond that. Fine-grained points are deleted first. See [retention](/docs/compute/observe/overview#retention).
## Why an instance restarted
The deployment lists instance events: an instance becoming `running`, `waiting`, or `terminated`, with its restart count, exit code, and a reason. Two reasons to know:
* **`OOMKilled`** (often with exit code `137`): the instance ran out of memory. Raise the memory limit.
* **`CrashLoopBackOff`:** the process keeps exiting before the [health check](/docs/compute/configure/health-checks) passes. The [runtime logs](/docs/compute/observe/runtime-logs) for that instance say why.
Events are kept for 90 days.
## Network view
The **Network** view shows each region and running instance with its request rate over the last 15 minutes. Use it to check that every region gets traffic and that load is spread across instances. See [Regions](/docs/compute/concepts/regions).